


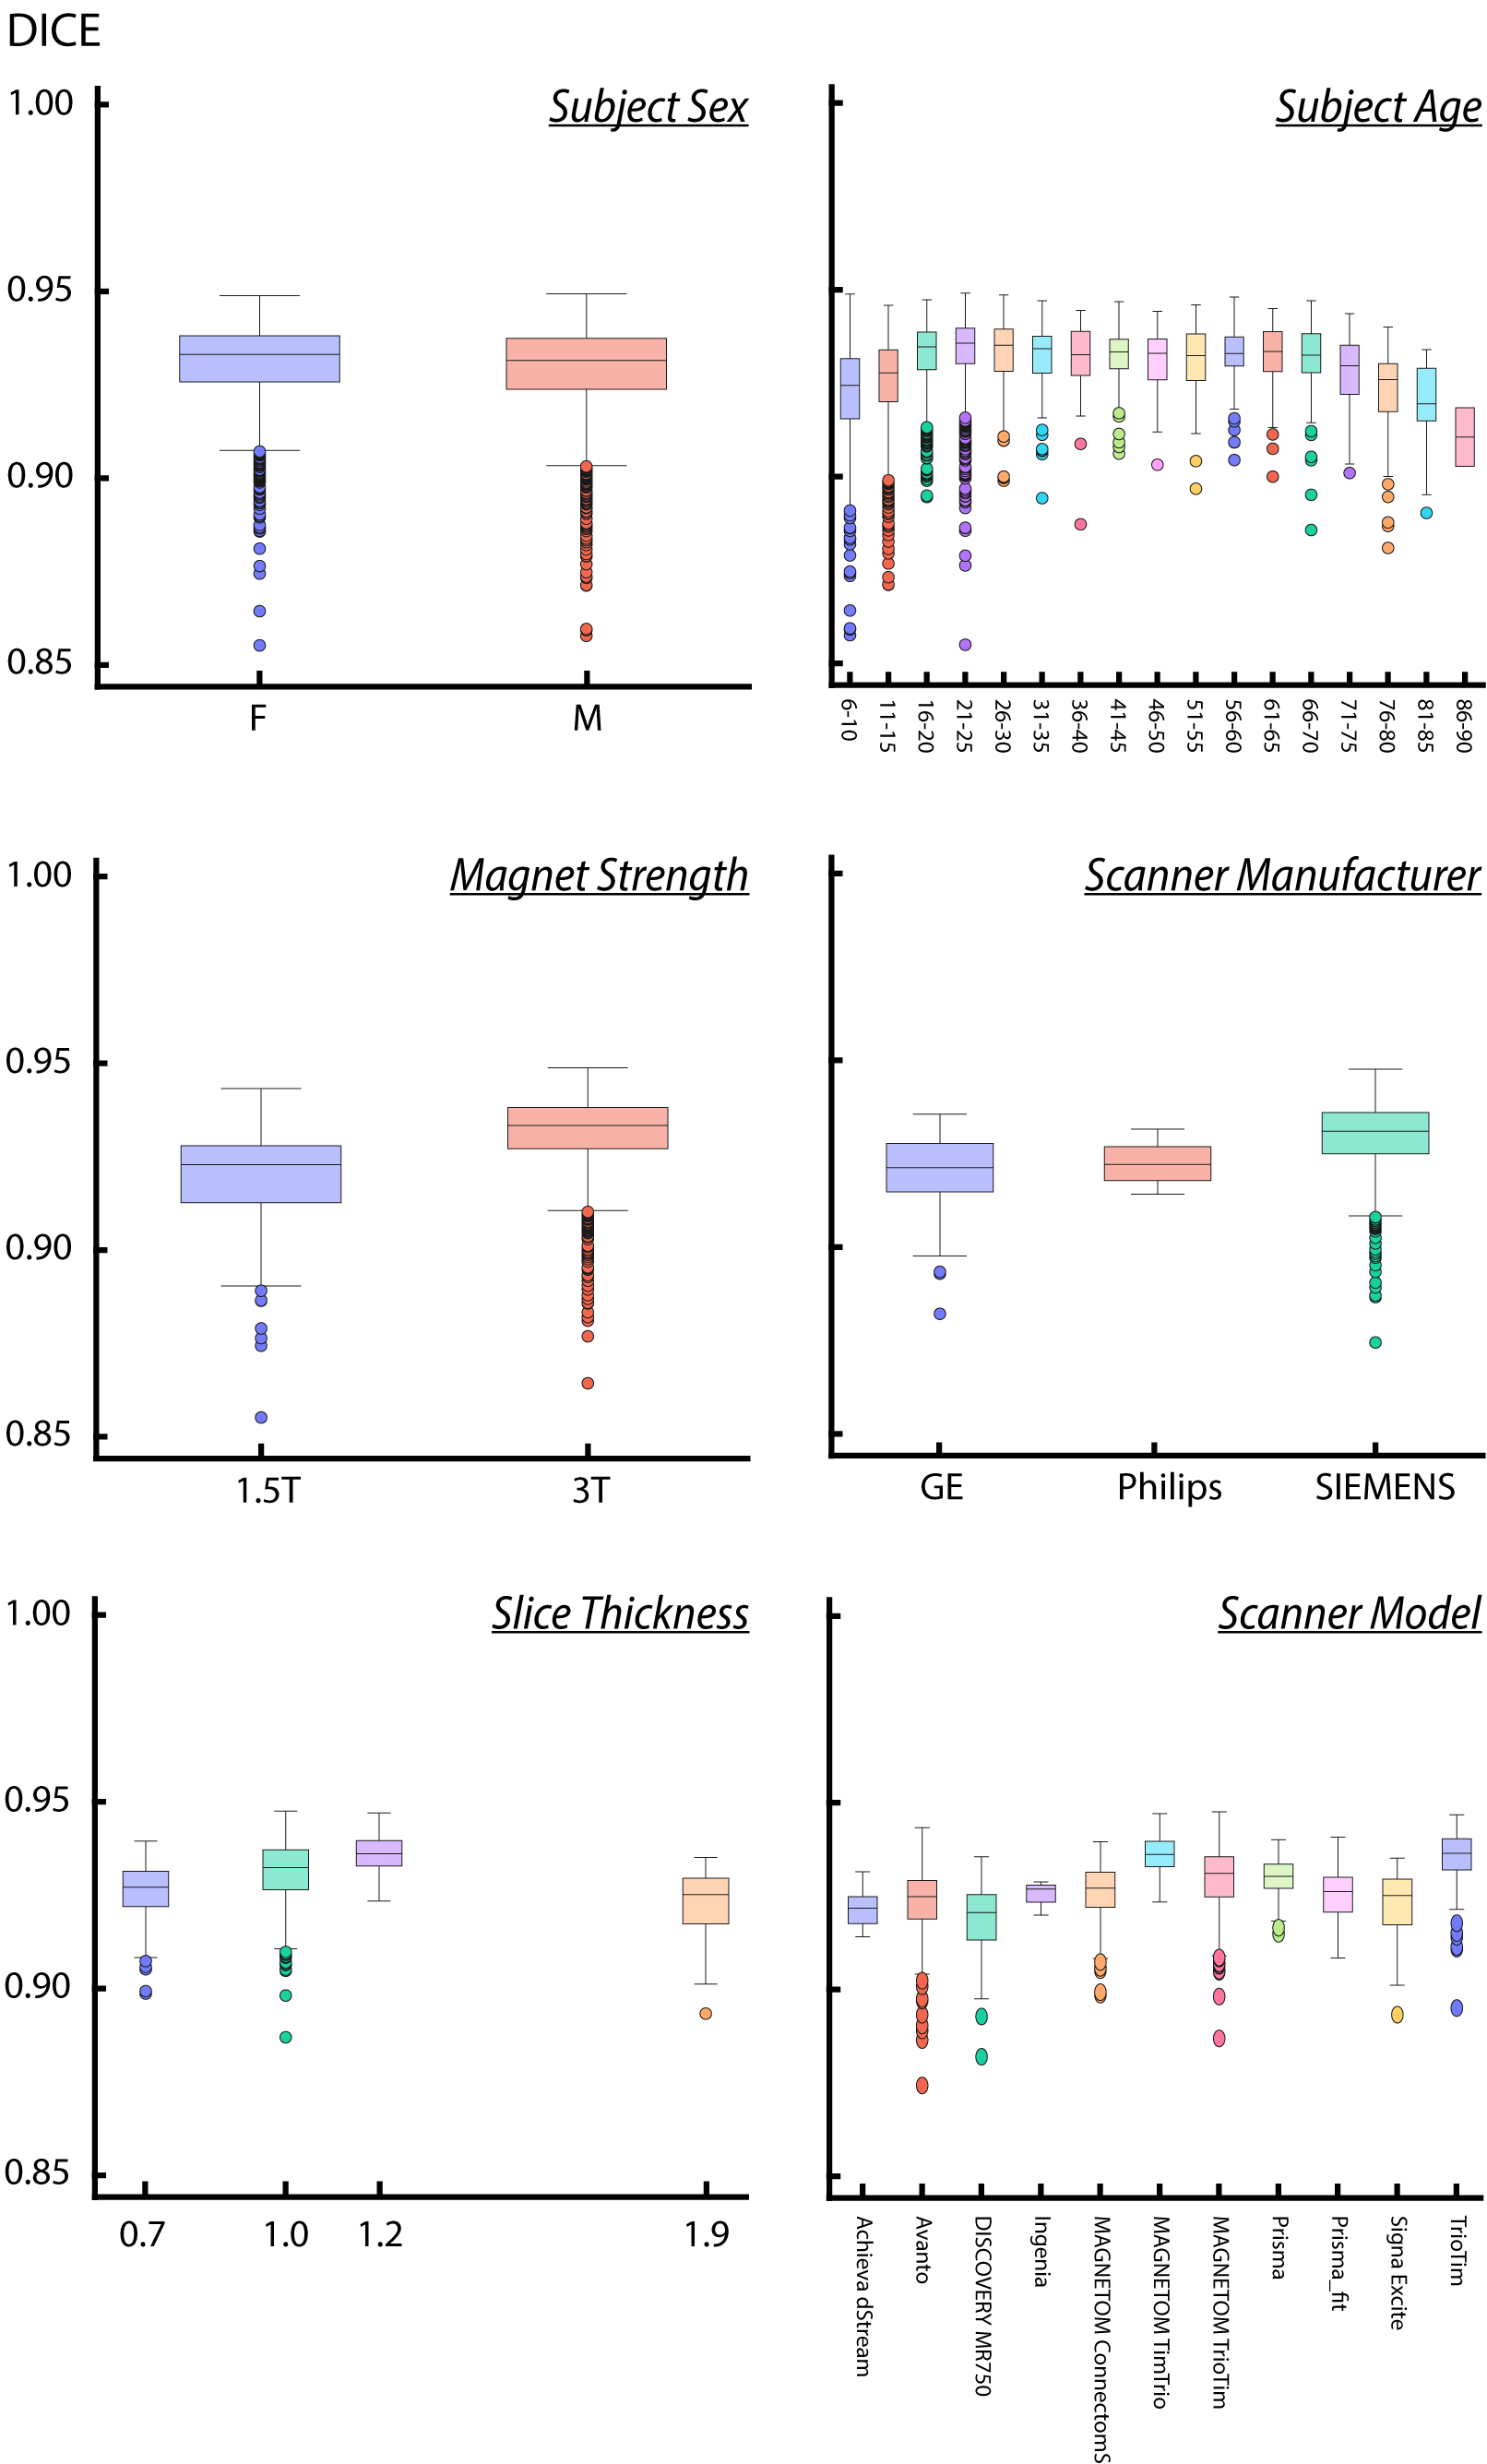
Bias results
Figure: Dice similarity coefficient for different groups based on demographics and technical characteristics. From top left to bottom right: sex, age, magnet strength, scanner manufacturer, slide thickness, scanner model. All results are obtained on the balanced testing set of 5949 volumes.
.